NOAH Disruptor List
An overview of the largest disruptors (measured by total funding raised) across our 10 NOAH Berlin industry verticals.
2 The NOAH Conference Berlin
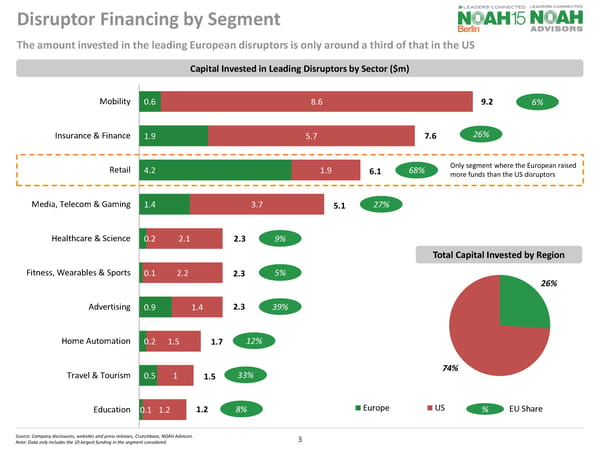
Disruptor Financing by Segment Source: Company disclosures, websites and press releases, Crunchbase, NOAH Advisors. Note: Data only includes the 10 largest funding in the segment considered. 3 0.6 1.9 4.2 1.4 0.2 0.1 0.9 0.2 0.5 0.1 8.6 5.7 1.9 3.7 2.1 2.2 1.4 1.5 1 1.2 Mobility Insurance & Finance Retail Media, Telecom & Gaming Healthcare & Science Fitness, Wearables & Sports Advertising Home Automation Travel & Tourism EducationEuropeUS The amount invested in the leading European disruptors is only around a third of that in the US 6% 12% 39% 5% 9% 27% 68% 26% 8% 33% % EU Share Capital Invested in Leading Disruptors by Sector ($m) 9.2 7.6 6.1 5.1 2.3 2.3 2.3 1.7 1.5 1.2 Only segment where the European raised more funds than the US disruptors 26% 74% Total Capital Invested by Region
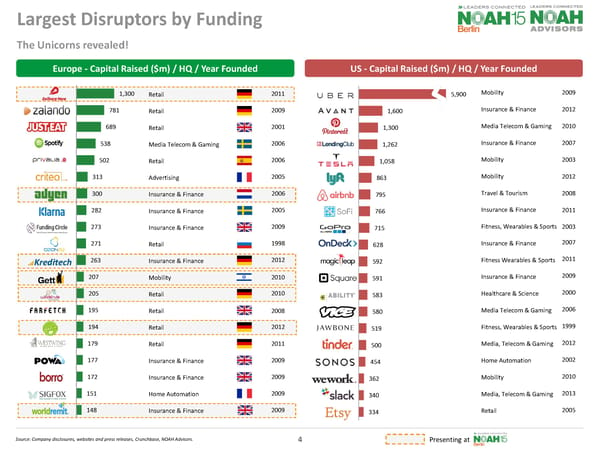
Largest Disruptors by Funding Europe - Capital Raised ($m) / HQ / Year Founded US - Capital Raised ($m) / HQ / Year Founded Source: Company disclosures, websites and press releases, Crunchbase, NOAH Advisors. 4 1,300 781 689 538 502 313 300 282 273 271 263 207 205 195 194 179 177 172 151 148 Retail Retail Retail Media Telecom & Gaming Retail Advertising Insurance & Finance Insurance & Finance Insurance & Finance Retail Insurance & Finance Mobility Retail Retail Retail Retail Insurance & Finance Insurance & Finance Home Automation Insurance & Finance 2011 2011 2009 2006 2001 2006 2005 2006 2009 1998 2012 2010 2012 2005 2009 2009 2009 2009 2009 2012 2012 2007 2010 2003 2012 2008 2007 2011 2009 2000 2006 1999 2003 2013 2005 2002 2010 5,900 1,600 1,300 1,262 1,058 863 795 766 715 628 592 591 583 580 519 500 454 362 340 334 Uber Avant Pinterest Lending Club Tesla Lyft Airbnb Sofi Gopro Ondeck Magic Leap Square ability Vice jawbone Tinder Sonos wework slack Etsy Mobility Insurance & Finance Media Telecom & Gaming Insurance & Finance Mobility Mobility Travel & Tourism Insurance & Finance Fitness, Wearables & Sports Insurance & Finance Fitness Wearables & Sports Insurance & Finance Healthcare & Science Media Telecom & Gaming Fitness, Wearables & Sports Media, Telecom & Gaming Home Automation Mobility Media, Telecom & Gaming Retail Presenting at The Unicorns revealed! 2010 2008 2011
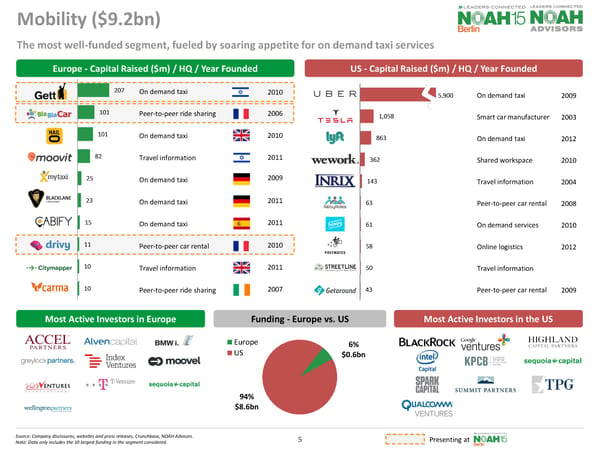
Ç√ Ç√ 5,900 1,058 863 362 143 63 61 58 50 43 Uber Tesla Lyft WeWork INRIX RelayRides Handy Postmates Streetline Getaround 207 101 101 82 25 23 15 11 10 10 gett BlaBlaCar Hailo Moovit mytaxi Blacklane Cabify Drivy Citymapper Carma The most well-funded segment, fueled by soaring appetite for on demand taxi services Mobility ($9.2bn) 2006 2010 2011 2011 2011 2009 2010 2011 2007 2009 2003 2012 2010 2004 2008 2009 2010 2012 Presenting at On demand taxi Peer-to-peer ride sharing On demand taxi Travel information On demand taxi On demand taxi On demand taxi Peer-to-peer car rental Travel information Peer-to-peer ride sharing On demand taxi Smart car manufacturer On demand taxi Shared workspace Travel information Peer-to-peer car rental On demand services Online logistics Travel information Peer-to-peer car rental 6% $0.6bn 94% $8.6bn Europe US 5 Source: Company disclosures, websites and press releases, Crunchbase, NOAH Advisors. Note: Data only includes the 10 largest funding in the segment considered. Europe - Capital Raised ($m) / HQ / Year Founded US - Capital Raised ($m) / HQ / Year Founded Funding - Europe vs. US Most Active Investors in Europe Most Active Investors in the US 2010
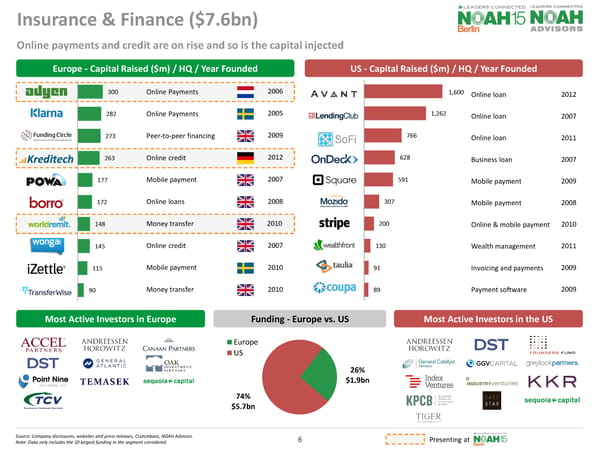
Online payments and credit are on rise and so is the capital injected Insurance & Finance ($7.6bn) 2006 300 282 273 263 177 172 148 145 115 90 Adyen Klarna Funding Circle Kreditech Powa Technologies Borro WorldRemit Wonga iZettle eToro 2005 2009 2012 2007 2008 2010 2007 2010 2010 2012 1,600 1,262 766 628 591 307 200 130 91 89 Avant Lending Club Sofi Ondeck Square Mozido Stripe Wealthfront Taulia Coupa Software 2007 2007 2009 2008 2010 2011 2009 2009 Europe - Capital Raised ($m) / HQ / Year Founded US - Capital Raised ($m) / HQ / Year Founded Online Payments Online Payments Peer-to-peer financing Online credit Mobile payment Online loans Money transfer Online credit Mobile payment Money transfer Online loan Online loan Online loan Business loan Mobile payment Mobile payment Online & mobile payment Wealth management Invoicing and payments Payment software 26% $1.9bn 74% $5.7bn Europe US 6 Source: Company disclosures, websites and press releases, Crunchbase, NOAH Advisors. Note: Data only includes the 10 largest funding in the segment considered. Funding - Europe vs. US Most Active Investors in Europe Most Active Investors in the US Presenting at 2011
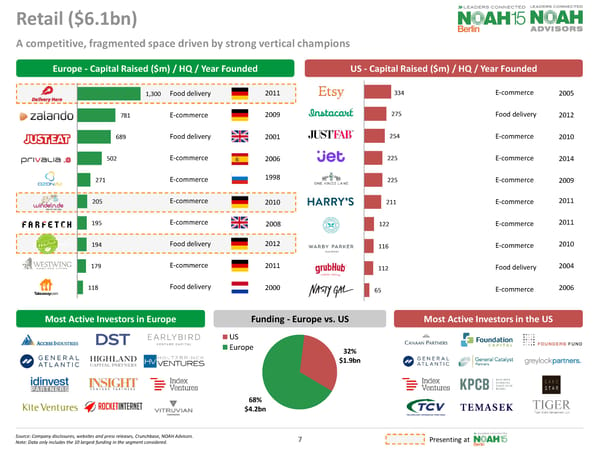
Retail ($6.1bn) 2010 68% $4.2bn 32% $1.9bn US Europe 1,300 781 689 502 271 205 195 194 179 118 Zalando Just Eat Privalia ozon.ru Farfetch HelloFresh WestWing Takeaway.com 2011 2011 2001 2006 1998 2009 2000 2012 2005 334 275 254 225 225 211 122 116 112 65 Etsy Instacart JustFab Jet One Kings Lane HARRY'S Honest Co. Warby Parker GrubHub Nasty Gal 2012 2010 2014 2006 2009 2011 2010 2004 Source: Company disclosures, websites and press releases, Crunchbase, NOAH Advisors. Note: Data only includes the 10 largest funding in the segment considered. A competitive, fragmented space driven by strong vertical champions Food delivery E-commerce Food delivery E-commerce E-commerce E-commerce E-commerce Food delivery E-commerce Food delivery E-commerce Food delivery E-commerce E-commerce E-commerce E-commerce E-commerce E-commerce Food delivery E-commerce 7 Europe - Capital Raised ($m) / HQ / Year Founded US - Capital Raised ($m) / HQ / Year Founded Funding - Europe vs. US Most Active Investors in Europe Most Active Investors in the US Presenting at 2008 2011
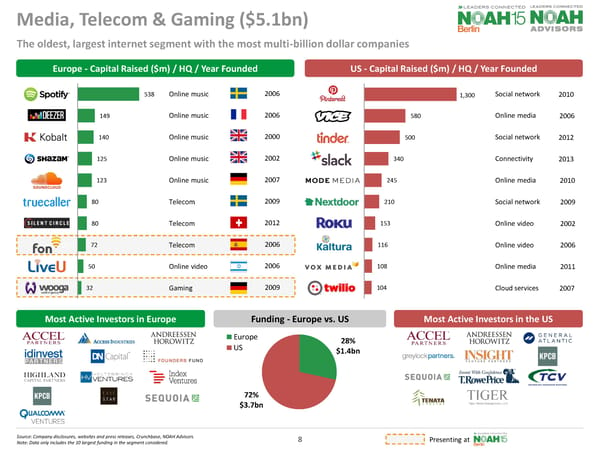
Media, Telecom & Gaming ($5.1bn) 2006 28% $1.4bn 72% $3.7bn Europe US 538 149 140 125 123 80 80 72 50 32 Spotify Deezeer Kobalt Shazam SoundCloud Truecaller Silent Circle Fon LiveU Wooga 2006 2009 2000 2002 2007 2009 2012 2006 2006 2010 1,300 580 500 340 245 210 153 116 108 104 Pinterest Vice Media Tinder Slack Mode Media Nextdoor Roku Kaltura Vox Media Twilio 2006 2012 2013 2011 2010 2009 2007 2002 2006 Source: Company disclosures, websites and press releases, Crunchbase, NOAH Advisors. Note: Data only includes the 10 largest funding in the segment considered. The oldest, largest internet segment with the most multi-billion dollar companies Online music Online music Online music Online music Online music Telecom Telecom Telecom Online video Gaming Social network Online media Social network Connectivity Online media Social network Online video Online video Online media Cloud services 8 Europe - Capital Raised ($m) / HQ / Year Founded US - Capital Raised ($m) / HQ / Year Founded Funding - Europe vs. US Most Active Investors in Europe Most Active Investors in the US Presenting at
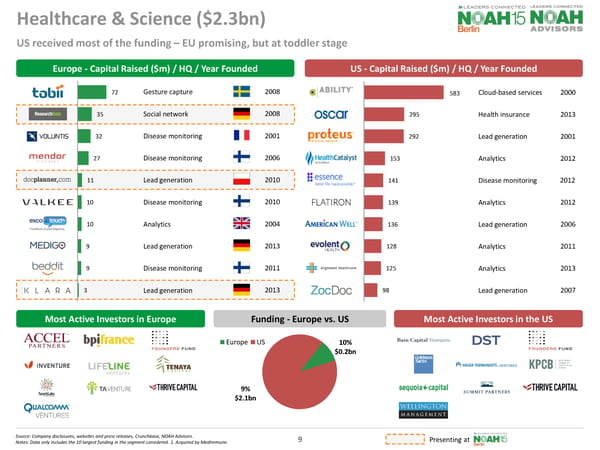
US received most of the funding – EU promising, but at toddler stage Healthcare & Science ($2.3bn) 2008 72 35 32 27 11 10 10 9 9 3 2001 2006 2010 2010 2004 2013 2011 2013 2000 583 295 292 153 141 139 136 128 125 98 2013 2001 2012 2006 2011 2013 2007 Cloud-based services Health insurance Lead generation Analytics Disease monitoring Analytics Lead generation Analytics Analytics Lead generation 10% $0.2bn 9% $2.1bn EuropeUS 2008 2012 2012 Gesture capture Social network Disease monitoring Disease monitoring Lead generation Disease monitoring Analytics Lead generation Disease monitoring Lead generation 9 Source: Company disclosures, websites and press releases, Crunchbase, NOAH Advisors. Notes: Data only includes the 10 largest funding in the segment considered. 1. Acquired by MedImmune. Europe - Capital Raised ($m) / HQ / Year Founded US - Capital Raised ($m) / HQ / Year Founded Funding - Europe vs. US Most Active Investors in Europe Most Active Investors in the US Presenting at
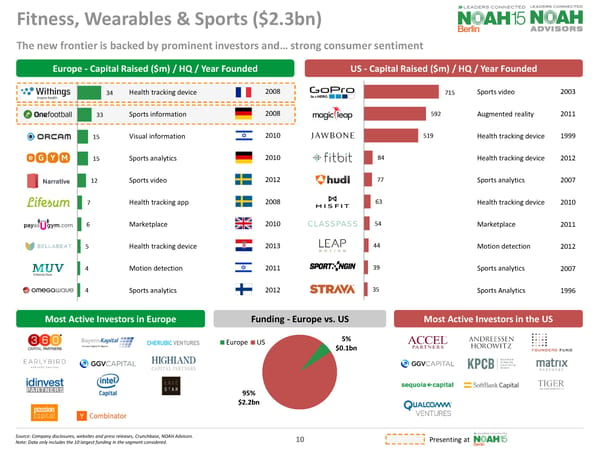
The new frontier is backed by prominent investors and… strong consumer sentiment Fitness, Wearables & Sports ($2.3bn) 2008 34 33 15 15 12 7 6 5 4 4 2008 2010 2010 2012 2008 2010 2013 2011 2012 2003 715 592 519 84 77 63 54 44 39 35 2011 1999 1996 2012 2007 2007 2010 2011 2012 Health tracking device Sports information Visual information Sports analytics Sports video Health tracking app Marketplace Health tracking device Motion detection Sports analytics Sports video Augmented reality Health tracking device Health tracking device Sports analytics Health tracking device Marketplace Motion detection Sports analytics Sports Analytics 5% $0.1bn 95% $2.2bn EuropeUS 10 Source: Company disclosures, websites and press releases, Crunchbase, NOAH Advisors. Note: Data only includes the 10 largest funding in the segment considered. Europe - Capital Raised ($m) / HQ / Year Founded US - Capital Raised ($m) / HQ / Year Founded Funding - Europe vs. US Most Active Investors in Europe Most Active Investors in the US Presenting at
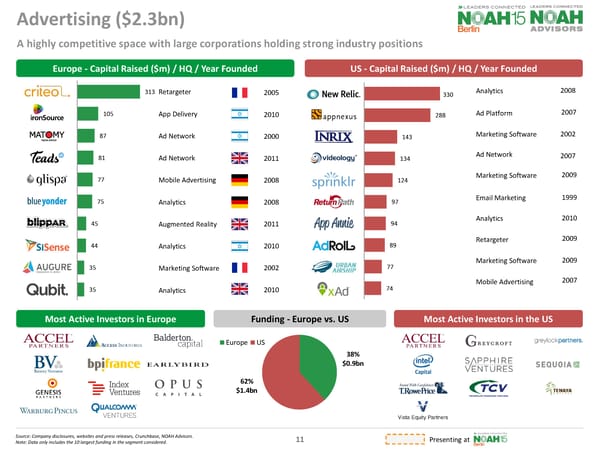
Advertising ($2.3bn) 2005 38% $0.9bn 62% $1.4bn EuropeUS 313 105 87 81 77 75 45 44 35 35 2010 2010 2000 2011 2008 2008 2011 2010 2002 2008 330 288 143 134 124 97 94 89 77 74 New Relic AppNexus INRIX Videology Sprinklr Return Path App Annie AdRoll Urban Airship xAd 2007 2002 2007 2009 2009 1999 2007 2010 2009 A highly competitive space with large corporations holding strong industry positions Retargeter App Delivery Ad Network Ad Network Mobile Advertising Analytics Augmented Reality Analytics Marketing Software Analytics Analytics Ad Platform Marketing Software Ad Network Marketing Software Email Marketing Analytics Retargeter Marketing Software Mobile Advertising 11 Source: Company disclosures, websites and press releases, Crunchbase, NOAH Advisors. Note: Data only includes the 10 largest funding in the segment considered. Europe - Capital Raised ($m) / HQ / Year Founded US - Capital Raised ($m) / HQ / Year Founded Funding - Europe vs. US Most Active Investors in Europe Most Active Investors in the US Presenting at
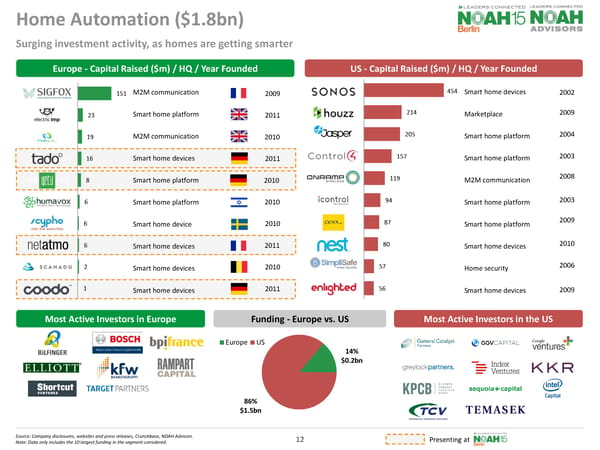
Home Automation ($1.8bn) 2009 14% $0.2bn 86% $1.5bn EuropeUS 151 23 19 16 8 6 6 6 2 SIGFOX Electric Imp Neul tado° orderbird AG yetu Humavox Scypho Netatmo coodo1 2011 2010 2010 2011 2011 2010 2010 2010 2011 2002 454 214 205 157 119 94 87 80 57 56 2009 2004 2003 2006 2008 2003 2009 2009 2010 Surging investment activity, as homes are getting smarter M2M communication Smart home platform M2M communication Smart home devices Smart home platform Smart home platform Smart home device Smart home devices Smart home devices Smart home devices Smart home devices Marketplace Smart home platform Smart home platform M2M communication Smart home platform Smart home platform Smart home devices Home security Smart home devices 12 Source: Company disclosures, websites and press releases, Crunchbase, NOAH Advisors. Note: Data only includes the 10 largest funding in the segment considered. Europe - Capital Raised ($m) / HQ / Year Founded US - Capital Raised ($m) / HQ / Year Founded Funding - Europe vs. US Most Active Investors in Europe Most Active Investors in the US Presenting at
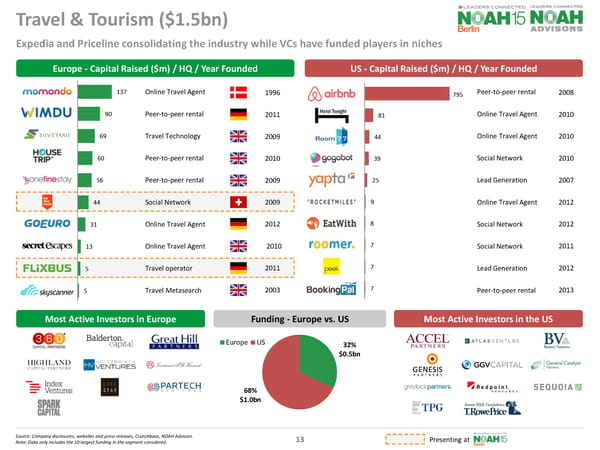
795 81 44 39 25 9 8 7 7 7 Pinterest Vice Media Tinder Slack Mode Media Nextdoor Roku Kaltura Vox Media BookingPal Travel & Tourism ($1.5bn) 1996 32% $0.5bn 68% $1.0bn EuropeUS 137 90 69 60 56 44 31 13 5 5 2011 2003 2009 2010 2009 2012 2009 2010 2008 2010 2010 2010 2012 2007 2012 2013 2012 2011 Expedia and Priceline consolidating the industry while VCs have funded players in niches Online Travel Agent Peer-to-peer rental Travel Technology Peer-to-peer rental Peer-to-peer rental Social Network Online Travel Agent Online Travel Agent Travel operator Travel Metasearch Peer-to-peer rental Online Travel Agent Online Travel Agent Social Network Lead Generation Online Travel Agent Social Network Social Network Lead Generation Peer-to-peer rental 2011 13 Source: Company disclosures, websites and press releases, Crunchbase, NOAH Advisors. Note: Data only includes the 10 largest funding in the segment considered. Europe - Capital Raised ($m) / HQ / Year Founded US - Capital Raised ($m) / HQ / Year Founded Funding - Europe vs. US Most Active Investors in Europe Most Active Investors in the US Presenting at
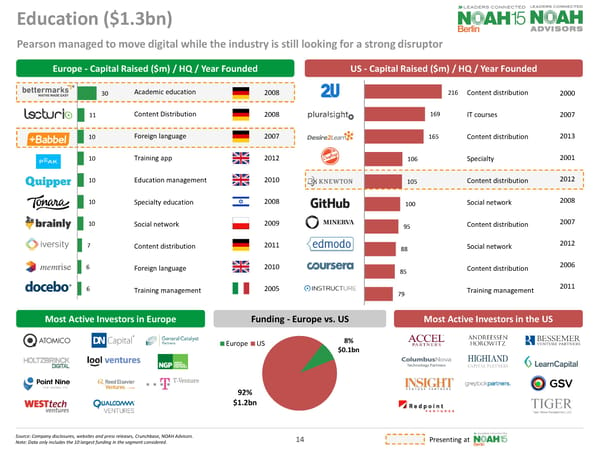
216 169 165 106 105 100 95 88 85 79 Education ($1.3bn) 2008 30 11 10 10 10 10 10 7 6 6 Lecturio Babbel Peak Quipper Tonara Brainly iversity Memrise Docebo 2007 2012 2010 2008 2009 2011 2010 2005 2008 2000 2007 2013 2001 2012 2008 2007 2012 2006 2011 Academic education Content Distribution Foreign language Training app Education management Specialty education Social network Content distribution Foreign language Training management Content distribution IT courses Content distribution Specialty Content distribution Social network Content distribution Social network Content distribution Training management 8% $0.1bn 92% $1.2bn EuropeUS Pearson managed to move digital while the industry is still looking for a strong disruptor 14 Source: Company disclosures, websites and press releases, Crunchbase, NOAH Advisors. Note: Data only includes the 10 largest funding in the segment considered. Europe - Capital Raised ($m) / HQ / Year Founded US - Capital Raised ($m) / HQ / Year Founded Funding - Europe vs. US Most Active Investors in Europe Most Active Investors in the US Presenting at
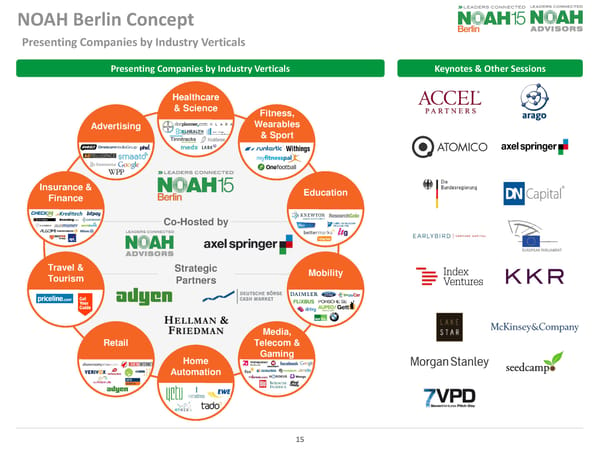
NOAH Berlin Concept Presenting Companies by Industry Verticals Healthcare & Science Fitness, Wearables & Sport Advertising Insurance & Finance Education Travel & Tourism Mobility Media, Telecom & Gaming Retail Home Automation Co-Hosted by Strategic Partners 15 Presenting Companies by Industry Verticals Keynotes & Other Sessions
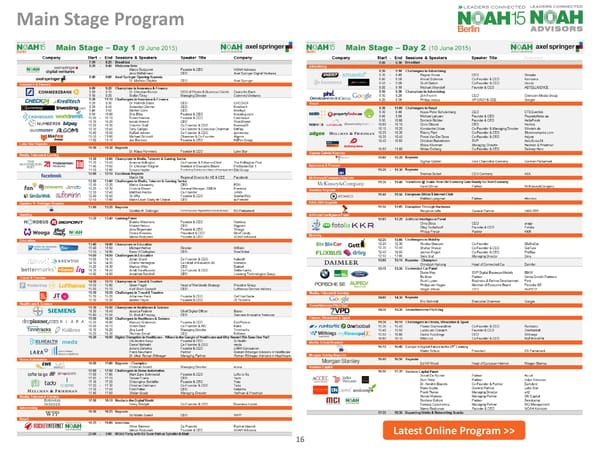
Main Stage Program Latest Online Program >> 16
The NOAH Ecosystem 17 Includes only a small sample of companies regularly attending NOAH Conferences. Corporates Internet Investors “Where Business Gets Done!”! Venture'Capital' Growth'Capital' Buyout' Recrui5ng'PR'Legal' Accoun5ng'Banking'Press' Media'Large'Cap'Internet'Other' Early Stage Late Stage The$graphic$reflects$only$a$small$selec3on$of$current/past$a7ending$companies$ Service Providers
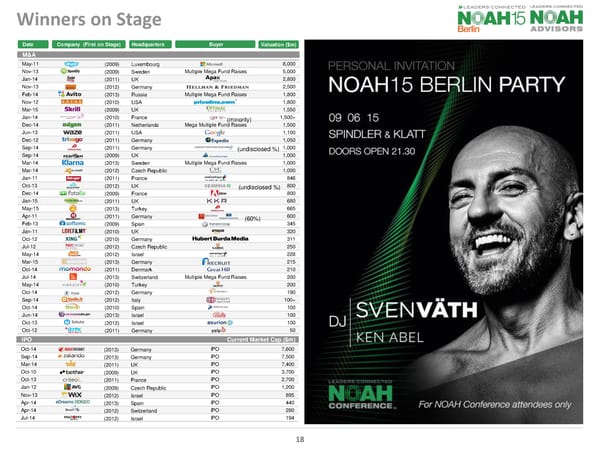
18 Winners on Stage Oct-14(2013)GermanyIPO7,600 Sep-14(2013)GermanyIPO7,500 Mar-14(2011)UKIPO7,400 Oct-10(2009)UKIPO3,700 Oct-13(2011)FranceIPO2,700 Jan-12(2009)Czech RepublicIPO1,200 Nov-13(2012)IsraelIPO895 Apr-14(2013)SpainIPO440 Apr-14(2012)SwitzerlandIPO280 Jul-14(2012)IsraelIPO194 May-11(2009)Luxembourg8,000 Nov-13(2009)SwedenMultiple Mega Fund Raises5,000 Jan-14(2011)UK2,800 Nov-13(2012)Germany2,500 Feb-14(2013)RussiaMultiple Mega Fund Raises1,800 Nov-12(2010)USA1,800 Mar-15(2009)UK1,550 Jan-14(2010)France1,500+ Dec-14(2011)NetherlandsMega Multiple FundRaises1,500 Jun-13(2011)USA1,100 Dec-12(2011)Germany1,050 Sep-14(2011)Germany1,000 Sep-14(2009)UK1,000 Mar-14(2013)SwedenMultiple Mega Fund Raises1,000 Mar-14(2012)Czech Republic1,000 Jan-11(2011)France846 Oct-13(2012)UK800 Dec-14(2009)France800 Jan-15(2011)UK680 May-15(2013)Turkey665 Apr-11(2011)Germany600 Feb-13(2009)Spain345 Jan-11(2010)UK320 Oct-12(2010)Germany311 Jul-12(2012)CzechRepublic250 May-14(2012)Israel228 Mar-15(2013)Germany215 Oct-14(2011)Denmark210 Jul-14(2013)SwitzerlandMultiple Mega Fund Raises200 May-14(2010)Turkey200 Oct-14(2012)Germany190 Sep-14(2012)Italy100+ Oct-14(2010)Spain100 Jun-14(2013)Israel100 Oct-13(2012)Israel100 Oct-12(2011)Germany50 DateCompany(First on Stage)BuyerValuation ($m) M&A IPO Current Market Cap ($m) Headquarters (60%) (undisclosed %) (undisclosed %) (minority)
19
www.noah-conference.com www.noah-advisors.com www.linkedin.com/company/noah-conference www.twitter.com/noahconference www.facebook.com/NOAHConference www.youtube.com/user/NoahAdvisors www.slideshare.net/NOAHAdvisors
