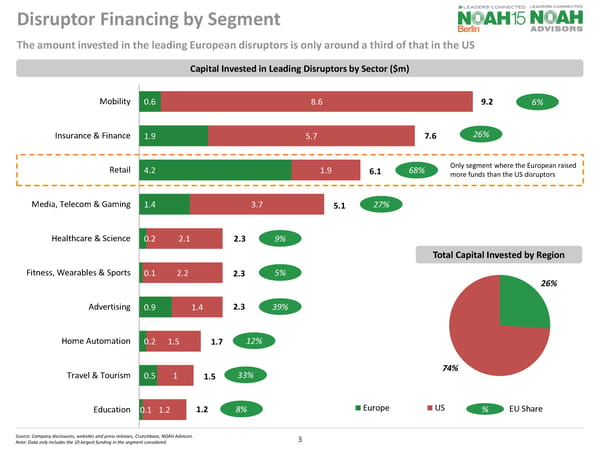
Disruptor Financing by Segment Source: Company disclosures, websites and press releases, Crunchbase, NOAH Advisors. Note: Data only includes the 10 largest funding in the segment considered. 3 0.6 1.9 4.2 1.4 0.2 0.1 0.9 0.2 0.5 0.1 8.6 5.7 1.9 3.7 2.1 2.2 1.4 1.5 1 1.2 Mobility Insurance & Finance Retail Media, Telecom & Gaming Healthcare & Science Fitness, Wearables & Sports Advertising Home Automation Travel & Tourism EducationEuropeUS The amount invested in the leading European disruptors is only around a third of that in the US 6% 12% 39% 5% 9% 27% 68% 26% 8% 33% % EU Share Capital Invested in Leading Disruptors by Sector ($m) 9.2 7.6 6.1 5.1 2.3 2.3 2.3 1.7 1.5 1.2 Only segment where the European raised more funds than the US disruptors 26% 74% Total Capital Invested by Region
 NOAH Disruptor List Page 2 Page 4