
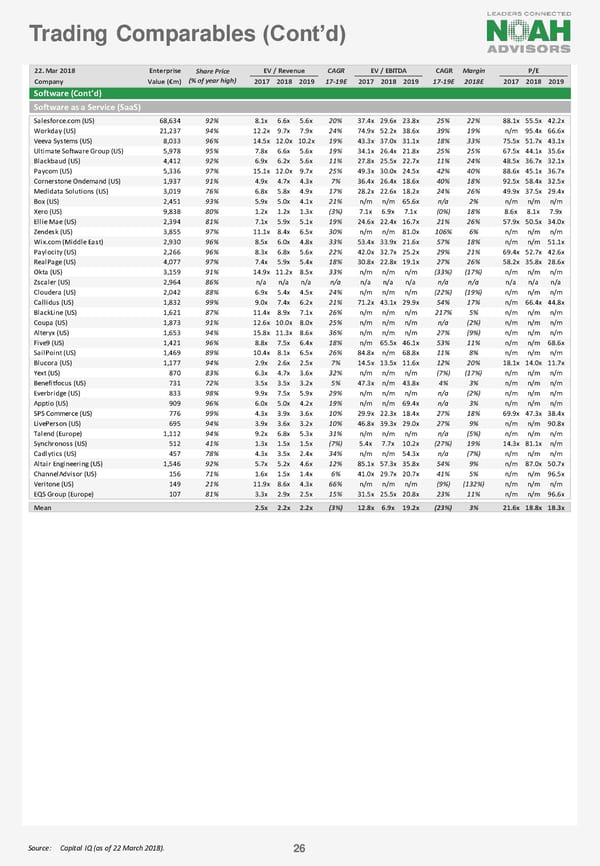
Trading Comparables (Cont’d) 22. Mar 2018 Enterprise Share Price EV / Revenue CAGR EV / EBITDA CAGR Margin P/E Company Value (€m) (% of year high) 2017 2018 2019 17-19E 2017 2018 2019 17-19E 2018E 2017 2018 2019 Software (Cont'd) Software as a Service (SaaS) Salesforce.com (US) 68,634 92% 8.1x 6.6x 5.6x 20% 37.4x 29.6x 23.8x 25% 22% 88.1x 55.5x 42.2x Workday (US) 21,237 94% 12.2x 9.7x 7.9x 24% 74.9x 52.2x 38.6x 39% 19% n/m 95.4x 66.6x Veeva Systems (US) 8,033 96% 14.5x 12.0x 10.2x 19% 43.3x 37.0x 31.1x 18% 33% 75.5x 51.7x 43.1x Ultimate Software Group (US) 5,978 95% 7.8x 6.6x 5.6x 19% 34.1x 26.4x 21.8x 25% 25% 67.5x 44.1x 35.6x Blackbaud (US) 4,412 92% 6.9x 6.2x 5.6x 11% 27.8x 25.5x 22.7x 11% 24% 48.5x 36.7x 32.1x Paycom (US) 5,336 97% 15.1x 12.0x 9.7x 25% 49.3x 30.0x 24.5x 42% 40% 88.6x 45.1x 36.7x Cornerstone Ondemand (US) 1,937 91% 4.9x 4.7x 4.3x 7% 36.4x 26.4x 18.6x 40% 18% 92.5x 58.4x 32.5x Medidata Solutions (US) 3,019 76% 6.8x 5.8x 4.9x 17% 28.2x 22.6x 18.2x 24% 26% 49.9x 37.5x 29.4x Box (US) 2,451 93% 5.9x 5.0x 4.1x 21% n/m n/m 65.6x n/a 2% n/m n/m n/m Xero (US) 9,838 80% 1.2x 1.2x 1.3x (3%) 7.1x 6.9x 7.1x (0%) 18% 8.6x 8.1x 7.9x Ellie Mae (US) 2,394 81% 7.1x 5.9x 5.1x 19% 24.6x 22.4x 16.7x 21% 26% 57.9x 50.5x 34.0x Zendesk (US) 3,855 97% 11.1x 8.4x 6.5x 30% n/m n/m 81.0x 10⁶% 6% n/m n/m n/m Wix.com (Middle East) 2,930 96% 8.5x 6.0x 4.8x 33% 53.4x 33.9x 21.6x 57% 18% n/m n/m 51.1x Paylocity (US) 2,266 96% 8.3x 6.8x 5.6x 22% 42.0x 32.7x 25.2x 29% 21% 69.4x 52.7x 42.6x RealPage (US) 4,077 97% 7.4x 5.9x 5.4x 18% 30.8x 22.8x 19.1x 27% 26% 58.2x 35.8x 28.6x Okta (US) 3,159 91% 14.9x 11.2x 8.5x 33% n/m n/m n/m (33%) (17%) n/m n/m n/m Zscaler (US) 2,964 86% n/a n/a n/a n/a n/a n/a n/a n/a n/a n/a n/a n/a Cloudera (US) 2,042 88% 6.9x 5.4x 4.5x 24% n/m n/m n/m (22%) (19%) n/m n/m n/m Callidus (US) 1,832 99% 9.0x 7.4x 6.2x 21% 71.2x 43.1x 29.9x 54% 17% n/m 66.4x 44.8x BlackLine (US) 1,621 87% 11.4x 8.9x 7.1x 26% n/m n/m n/m 217% 5% n/m n/m n/m Coupa (US) 1,873 91% 12.6x 10.0x 8.0x 25% n/m n/m n/m n/a (2%) n/m n/m n/m Alteryx (US) 1,653 94% 15.8x 11.3x 8.6x 36% n/m n/m n/m 27% (9%) n/m n/m n/m Five9 (US) 1,421 96% 8.8x 7.5x 6.4x 18% n/m 65.5x 46.1x 53% 11% n/m n/m 68.6x SailPoint (US) 1,469 89% 10.4x 8.1x 6.5x 26% 84.8x n/m 68.8x 11% 8% n/m n/m n/m Blucora (US) 1,177 94% 2.9x 2.6x 2.5x 7% 14.5x 13.5x 11.6x 12% 20% 18.1x 14.0x 11.7x Yext (US) 870 83% 6.3x 4.7x 3.6x 32% n/m n/m n/m (7%) (17%) n/m n/m n/m Benefitfocus (US) 731 72% 3.5x 3.5x 3.2x 5% 47.3x n/m 43.8x 4% 3% n/m n/m n/m Everbridge (US) 833 98% 9.9x 7.5x 5.9x 29% n/m n/m n/m n/a (2%) n/m n/m n/m Apptio (US) 909 96% 6.0x 5.0x 4.2x 19% n/m n/m 69.4x n/a 3% n/m n/m n/m SPS Commerce (US) 776 99% 4.3x 3.9x 3.6x 10% 29.9x 22.3x 18.4x 27% 18% 69.9x 47.3x 38.4x LivePerson (US) 695 94% 3.9x 3.6x 3.2x 10% 46.8x 39.3x 29.0x 27% 9% n/m n/m 90.8x Talend (Europe) 1,112 94% 9.2x 6.8x 5.3x 31% n/m n/m n/m n/a (5%) n/m n/m n/m Synchronoss (US) 512 41% 1.3x 1.5x 1.5x (7%) 5.4x 7.7x 10.2x (27%) 19% 14.3x 81.1x n/m Cadlytics (US) 457 78% 4.3x 3.5x 2.4x 34% n/m n/m 54.3x n/a (7%) n/m n/m n/m Altair Engineering (US) 1,546 92% 5.7x 5.2x 4.6x 12% 85.1x 57.3x 35.8x 54% 9% n/m 87.0x 50.7x ChannelAdvisor (US) 156 71% 1.6x 1.5x 1.4x 6% 41.0x 29.7x 20.7x 41% 5% n/m n/m 96.5x Veritone (US) 149 21% 11.9x 8.6x 4.3x 66% n/m n/m n/m (9%) (132%) n/m n/m n/m EQS Group (Europe) 107 81% 3.3x 2.9x 2.5x 15% 31.5x 25.5x 20.8x 23% 11% n/m n/m 96.6x Mean 2.5x 2.2x 2.2x (3%) 12.8x 6.9x 19.2x (23%) 3% 21.6x 18.8x 18.3x Source: Capital IQ (as of 22 March 2018). 26
 NOAH Bible Page 25 Page 27