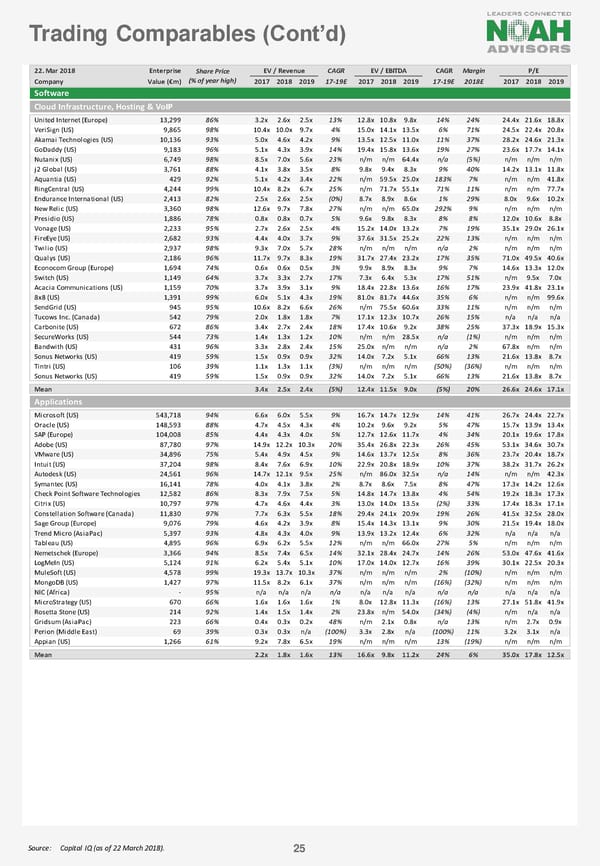
Trading Comparables (Cont’d) 22. Mar 2018 Enterprise Share Price EV / Revenue CAGR EV / EBITDA CAGR Margin P/E Company Value (€m) (% of year high) 2017 2018 2019 17-19E 2017 2018 2019 17-19E 2018E 2017 2018 2019 Software Cloud Infrastructure, Hosting & VoIP United Internet (Europe) 13,299 86% 3.2x 2.6x 2.5x 13% 12.8x 10.8x 9.8x 14% 24% 24.4x 21.6x 18.8x VeriSign (US) 9,865 98% 10.4x 10.0x 9.7x 4% 15.0x 14.1x 13.5x 6% 71% 24.5x 22.4x 20.8x Akamai Technologies (US) 10,136 93% 5.0x 4.6x 4.2x 9% 13.5x 12.5x 11.0x 11% 37% 28.2x 24.6x 21.3x GoDaddy (US) 9,183 96% 5.1x 4.3x 3.9x 14% 19.4x 15.8x 13.6x 19% 27% 23.6x 17.7x 14.1x Nutanix (US) 6,749 98% 8.5x 7.0x 5.6x 23% n/m n/m 64.4x n/a (5%) n/m n/m n/m j2 Global (US) 3,761 88% 4.1x 3.8x 3.5x 8% 9.8x 9.4x 8.3x 9% 40% 14.2x 13.1x 11.8x Aquantia (US) 429 92% 5.1x 4.2x 3.4x 22% n/m 59.5x 25.0x 183% 7% n/m n/m 41.8x RingCentral (US) 4,244 99% 10.4x 8.2x 6.7x 25% n/m 71.7x 55.1x 71% 11% n/m n/m 77.7x Endurance International (US) 2,413 82% 2.5x 2.6x 2.5x (0%) 8.7x 8.9x 8.6x 1% 29% 8.0x 9.6x 10.2x New Relic (US) 3,360 98% 12.6x 9.7x 7.8x 27% n/m n/m 65.0x 292% 9% n/m n/m n/m Presidio (US) 1,886 78% 0.8x 0.8x 0.7x 5% 9.6x 9.8x 8.3x 8% 8% 12.0x 10.6x 8.8x Vonage (US) 2,233 95% 2.7x 2.6x 2.5x 4% 15.2x 14.0x 13.2x 7% 19% 35.1x 29.0x 26.1x FireEye (US) 2,682 93% 4.4x 4.0x 3.7x 9% 37.6x 31.5x 25.2x 22% 13% n/m n/m n/m Twilio (US) 2,937 98% 9.3x 7.0x 5.7x 28% n/m n/m n/m n/a 2% n/m n/m n/m Qualys (US) 2,186 96% 11.7x 9.7x 8.3x 19% 31.7x 27.4x 23.2x 17% 35% 71.0x 49.5x 40.6x Econocom Group (Europe) 1,694 74% 0.6x 0.6x 0.5x 3% 9.9x 8.9x 8.3x 9% 7% 14.6x 13.3x 12.0x Switch (US) 1,149 64% 3.7x 3.3x 2.7x 17% 7.3x 6.4x 5.3x 17% 51% n/m 9.5x 7.0x Acacia Communications (US) 1,159 70% 3.7x 3.9x 3.1x 9% 18.4x 22.8x 13.6x 16% 17% 23.9x 41.8x 23.1x 8x8 (US) 1,391 99% 6.0x 5.1x 4.3x 19% 81.0x 81.7x 44.6x 35% 6% n/m n/m 99.6x SendGrid (US) 945 95% 10.6x 8.2x 6.6x 26% n/m 75.5x 60.6x 33% 11% n/m n/m n/m Tucows Inc. (Canada) 542 79% 2.0x 1.8x 1.8x 7% 17.1x 12.3x 10.7x 26% 15% n/a n/a n/a Carbonite (US) 672 86% 3.4x 2.7x 2.4x 18% 17.4x 10.6x 9.2x 38% 25% 37.3x 18.9x 15.3x SecureWorks (US) 544 73% 1.4x 1.3x 1.2x 10% n/m n/m 28.5x n/a (1%) n/m n/m n/m Bandwith (US) 431 96% 3.3x 2.8x 2.4x 15% 25.0x n/m n/m n/a 2% 67.8x n/m n/m Sonus Networks (US) 419 59% 1.5x 0.9x 0.9x 32% 14.0x 7.2x 5.1x 66% 13% 21.6x 13.8x 8.7x Tintri (US) 106 39% 1.1x 1.3x 1.1x (3%) n/m n/m n/m (50%) (36%) n/m n/m n/m Sonus Networks (US) 419 59% 1.5x 0.9x 0.9x 32% 14.0x 7.2x 5.1x 66% 13% 21.6x 13.8x 8.7x Mean 3.4x 2.5x 2.4x (5%) 12.4x 11.5x 9.0x (5%) 20% 26.6x 24.6x 17.1x Applications Microsoft (US) 543,718 94% 6.6x 6.0x 5.5x 9% 16.7x 14.7x 12.9x 14% 41% 26.7x 24.4x 22.7x Oracle (US) 148,593 88% 4.7x 4.5x 4.3x 4% 10.2x 9.6x 9.2x 5% 47% 15.7x 13.9x 13.4x SAP (Europe) 104,008 85% 4.4x 4.3x 4.0x 5% 12.7x 12.6x 11.7x 4% 34% 20.1x 19.6x 17.8x Adobe (US) 87,780 97% 14.9x 12.2x 10.3x 20% 35.4x 26.8x 22.3x 26% 45% 53.1x 34.6x 30.7x VMware (US) 34,896 75% 5.4x 4.9x 4.5x 9% 14.6x 13.7x 12.5x 8% 36% 23.7x 20.4x 18.7x Intuit (US) 37,204 98% 8.4x 7.6x 6.9x 10% 22.9x 20.8x 18.9x 10% 37% 38.2x 31.7x 26.2x Autodesk (US) 24,561 96% 14.7x 12.1x 9.5x 25% n/m 86.0x 32.5x n/a 14% n/m n/m 42.3x Symantec (US) 16,141 78% 4.0x 4.1x 3.8x 2% 8.7x 8.6x 7.5x 8% 47% 17.3x 14.2x 12.6x Check Point Software Technologies (Midd1le2 ,E5a8s2t) 86% 8.3x 7.9x 7.5x 5% 14.8x 14.7x 13.8x 4% 54% 19.2x 18.3x 17.3x Citrix (US) 10,797 97% 4.7x 4.6x 4.4x 3% 13.0x 14.0x 13.5x (2%) 33% 17.4x 18.3x 17.1x Constellation Software (Canada) 11,830 97% 7.7x 6.3x 5.5x 18% 29.4x 24.1x 20.9x 19% 26% 41.5x 32.5x 28.0x Sage Group (Europe) 9,076 79% 4.6x 4.2x 3.9x 8% 15.4x 14.3x 13.1x 9% 30% 21.5x 19.4x 18.0x Trend Micro (AsiaPac) 5,397 93% 4.8x 4.3x 4.0x 9% 13.9x 13.2x 12.4x 6% 32% n/a n/a n/a Tableau (US) 4,895 96% 6.9x 6.2x 5.5x 12% n/m n/m 66.0x 27% 5% n/m n/m n/m Nemetschek (Europe) 3,366 94% 8.5x 7.4x 6.5x 14% 32.1x 28.4x 24.7x 14% 26% 53.0x 47.6x 41.6x LogMeIn (US) 5,124 91% 6.2x 5.4x 5.1x 10% 17.0x 14.0x 12.7x 16% 39% 30.1x 22.5x 20.3x MuleSoft (US) 4,578 99% 19.3x 13.7x 10.3x 37% n/m n/m n/m 2% (10%) n/m n/m n/m MongoDB (US) 1,427 97% 11.5x 8.2x 6.1x 37% n/m n/m n/m (16%) (32%) n/m n/m n/m NIC (Africa) - 95% n/a n/a n/a n/a n/a n/a n/a n/a n/a n/a n/a n/a MicroStrategy (US) 670 66% 1.6x 1.6x 1.6x 1% 8.0x 12.8x 11.3x (16%) 13% 27.1x 51.8x 41.9x Rosetta Stone (US) 214 92% 1.4x 1.5x 1.4x 2% 23.8x n/m 54.0x (34%) (4%) n/m n/a n/a Gridsum (AsiaPac) 223 66% 0.4x 0.3x 0.2x 48% n/m 2.1x 0.8x n/a 13% n/m 2.7x 0.9x Perion (Middle East) 69 39% 0.3x 0.3x n/a (100%) 3.3x 2.8x n/a (100%) 11% 3.2x 3.1x n/a Appian (US) 1,266 61% 9.2x 7.8x 6.5x 19% n/m n/m n/m 13% (19%) n/m n/m n/m Mean 2.2x 1.8x 1.6x 13% 16.6x 9.8x 11.2x 24% 6% 35.0x 17.8x 12.5x Source: Capital IQ (as of 22 March 2018). 25
 NOAH Bible Page 24 Page 26