
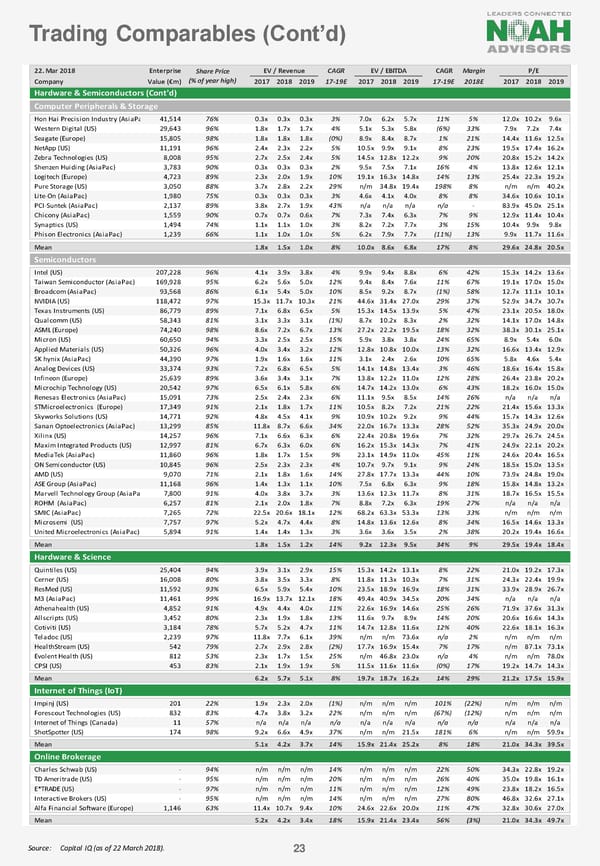
Trading Comparables (Cont’d) 22. Mar 2018 Enterprise Share Price EV / Revenue CAGR EV / EBITDA CAGR Margin P/E Company Value (€m) (% of year high) 2017 2018 2019 17-19E 2017 2018 2019 17-19E 2018E 2017 2018 2019 Hardware & Semiconductors (Cont'd) Computer Peripherals & Storage Hon Hai Precision Industry (AsiaPac) 41,514 76% 0.3x 0.3x 0.3x 3% 7.0x 6.2x 5.7x 11% 5% 12.0x 10.2x 9.6x Western Digital (US) 29,643 96% 1.8x 1.7x 1.7x 4% 5.1x 5.3x 5.8x (6%) 33% 7.9x 7.2x 7.4x Seagate (Europe) 15,805 98% 1.8x 1.8x 1.8x (0%) 8.9x 8.4x 8.7x 1% 21% 14.4x 11.6x 12.5x NetApp (US) 11,191 96% 2.4x 2.3x 2.2x 5% 10.5x 9.9x 9.1x 8% 23% 19.5x 17.4x 16.2x Zebra Technologies (US) 8,008 95% 2.7x 2.5x 2.4x 5% 14.5x 12.8x 12.2x 9% 20% 20.8x 15.2x 14.2x Shenzen Huiding (AsiaPac) 3,783 90% 0.3x 0.3x 0.3x 2% 9.5x 7.5x 7.1x 16% 4% 13.8x 12.6x 12.1x Logitech (Europe) 4,723 89% 2.3x 2.0x 1.9x 10% 19.1x 16.3x 14.8x 14% 13% 25.4x 22.3x 19.2x Pure Storage (US) 3,050 88% 3.7x 2.8x 2.2x 29% n/m 34.8x 19.4x 198% 8% n/m n/m 40.2x Lite-On (AsiaPac) 1,980 75% 0.3x 0.3x 0.3x 3% 4.6x 4.1x 4.0x 8% 8% 34.6x 10.6x 10.1x PCI-Suntek (AsiaPac) 2,137 89% 3.8x 2.7x 1.9x 43% n/a n/a n/a n/a - 83.9x 45.0x 25.1x Chicony (AsiaPac) 1,559 90% 0.7x 0.7x 0.6x 7% 7.3x 7.4x 6.3x 7% 9% 12.9x 11.4x 10.4x Synaptics (US) 1,494 74% 1.1x 1.1x 1.0x 3% 8.2x 7.2x 7.7x 3% 15% 10.4x 9.9x 9.8x Phison Electronics (AsiaPac) 1,239 66% 1.1x 1.0x 1.0x 5% 6.2x 7.9x 7.7x (11%) 13% 9.9x 11.7x 11.6x Mean 1.8x 1.5x 1.0x 8% 10.0x 8.6x 6.8x 17% 8% 29.6x 24.8x 20.5x Semiconductors Intel (US) 207,228 96% 4.1x 3.9x 3.8x 4% 9.9x 9.4x 8.8x 6% 42% 15.3x 14.2x 13.6x Taiwan Semiconductor (AsiaPac) 169,928 95% 6.2x 5.6x 5.0x 12% 9.4x 8.4x 7.6x 11% 67% 19.1x 17.0x 15.0x Broadcom (AsiaPac) 93,568 86% 6.1x 5.4x 5.0x 10% 8.5x 9.2x 8.7x (1%) 58% 12.7x 11.1x 10.1x NVIDIA (US) 118,472 97% 15.3x 11.7x 10.3x 21% 44.6x 31.4x 27.0x 29% 37% 52.9x 34.7x 30.7x Texas Instruments (US) 86,779 89% 7.1x 6.8x 6.5x 5% 15.3x 14.5x 13.9x 5% 47% 23.1x 20.5x 18.0x Qualcomm (US) 58,343 81% 3.1x 3.3x 3.1x (1%) 8.7x 10.2x 8.3x 2% 32% 14.1x 17.0x 14.8x ASML (Europe) 74,240 98% 8.6x 7.2x 6.7x 13% 27.2x 22.2x 19.5x 18% 32% 38.3x 30.1x 25.1x Micron (US) 60,650 94% 3.3x 2.5x 2.5x 15% 5.9x 3.8x 3.8x 24% 65% 8.9x 5.4x 6.0x Applied Materials (US) 50,326 96% 4.0x 3.4x 3.2x 12% 12.8x 10.8x 10.0x 13% 32% 16.6x 13.4x 12.9x SK hynix (AsiaPac) 44,390 97% 1.9x 1.6x 1.6x 11% 3.1x 2.4x 2.6x 10% 65% 5.8x 4.6x 5.4x Analog Devices (US) 33,374 93% 7.2x 6.8x 6.5x 5% 14.1x 14.8x 13.4x 3% 46% 18.6x 16.4x 15.8x Infineon (Europe) 25,639 89% 3.6x 3.4x 3.1x 7% 13.8x 12.2x 11.0x 12% 28% 26.4x 23.8x 20.2x Microchip Technology (US) 20,542 97% 6.5x 6.1x 5.8x 6% 14.7x 14.2x 13.0x 6% 43% 18.2x 16.0x 15.0x Renesas Electronics (AsiaPac) 15,091 73% 2.5x 2.4x 2.3x 6% 11.1x 9.5x 8.5x 14% 26% n/a n/a n/a STMicroelectronics (Europe) 17,349 91% 2.1x 1.8x 1.7x 11% 10.5x 8.2x 7.2x 21% 22% 21.4x 15.6x 13.3x Skyworks Solutions (US) 14,771 92% 4.8x 4.5x 4.1x 9% 10.9x 10.2x 9.2x 9% 44% 15.7x 14.3x 12.6x Sanan Optoelectronics (AsiaPac) 13,299 85% 11.8x 8.7x 6.6x 34% 22.0x 16.7x 13.3x 28% 52% 35.3x 24.9x 20.0x Xilinx (US) 14,257 96% 7.1x 6.6x 6.3x 6% 22.4x 20.8x 19.6x 7% 32% 29.7x 26.7x 24.5x Maxim Integrated Products (US) 12,997 81% 6.7x 6.3x 6.0x 6% 16.2x 15.3x 14.3x 7% 41% 24.9x 22.1x 20.2x MediaTek (AsiaPac) 11,860 96% 1.8x 1.7x 1.5x 9% 23.1x 14.9x 11.0x 45% 11% 24.6x 20.4x 16.5x ON Semiconductor (US) 10,845 96% 2.5x 2.3x 2.3x 4% 10.7x 9.7x 9.1x 9% 24% 18.5x 15.0x 13.5x AMD (US) 9,070 71% 2.1x 1.8x 1.6x 14% 27.8x 17.7x 13.3x 44% 10% 73.9x 24.8x 19.0x ASE Group (AsiaPac) 11,168 96% 1.4x 1.3x 1.1x 10% 7.5x 6.8x 6.3x 9% 18% 15.8x 14.8x 13.2x Marvell Technology Group (AsiaPac) 7,800 91% 4.0x 3.8x 3.7x 3% 13.6x 12.3x 11.7x 8% 31% 18.7x 16.5x 15.5x ROHM (AsiaPac) 6,257 81% 2.1x 2.0x 1.8x 7% 8.8x 7.2x 6.3x 19% 27% n/a n/a n/a SMIC (AsiaPac) 7,265 72% 22.5x 20.6x 18.1x 12% 68.2x 63.3x 53.3x 13% 33% n/m n/m n/m Microsemi (US) 7,757 97% 5.2x 4.7x 4.4x 8% 14.8x 13.6x 12.6x 8% 34% 16.5x 14.6x 13.3x United Microelectronics (AsiaPac) 5,894 91% 1.4x 1.4x 1.3x 3% 3.6x 3.6x 3.5x 2% 38% 20.2x 19.4x 16.6x Mean 1.8x 1.5x 1.2x 14% 9.2x 12.3x 9.5x 34% 9% 29.5x 19.4x 18.4x Hardware & Science Quintiles (US) 25,404 94% 3.9x 3.1x 2.9x 15% 15.3x 14.2x 13.1x 8% 22% 21.0x 19.2x 17.3x Cerner (US) 16,008 80% 3.8x 3.5x 3.3x 8% 11.8x 11.3x 10.3x 7% 31% 24.3x 22.4x 19.9x ResMed (US) 11,592 93% 6.5x 5.9x 5.4x 10% 23.5x 18.9x 16.9x 18% 31% 33.9x 28.9x 26.7x M3 (AsiaPac) 11,461 99% 16.9x 13.7x 12.1x 18% 49.4x 40.9x 34.5x 20% 34% n/a n/a n/a Athenahealth (US) 4,852 91% 4.9x 4.4x 4.0x 11% 22.6x 16.9x 14.6x 25% 26% 71.9x 37.6x 31.3x Allscripts (US) 3,452 80% 2.3x 1.9x 1.8x 13% 11.6x 9.7x 8.9x 14% 20% 20.6x 16.6x 14.3x Cotiviti (US) 3,184 78% 5.7x 5.2x 4.7x 11% 14.7x 12.8x 11.6x 12% 40% 22.6x 18.1x 16.3x Teladoc (US) 2,239 97% 11.8x 7.7x 6.1x 39% n/m n/m 73.6x n/a 2% n/m n/m n/m HealthStream (US) 542 79% 2.7x 2.9x 2.8x (2%) 17.7x 16.9x 15.4x 7% 17% n/m 87.1x 73.1x Evolent Health (US) 812 53% 2.3x 1.7x 1.5x 25% n/m 46.8x 23.0x n/a 4% n/m n/m 78.0x CPSI (US) 453 83% 2.1x 1.9x 1.9x 5% 11.5x 11.6x 11.6x (0%) 17% 19.2x 14.7x 14.3x Mean 6.2x 5.7x 5.1x 8% 19.7x 18.7x 16.2x 14% 29% 21.2x 17.5x 15.9x Internet of Things (IoT) Impinj (US) 201 22% 1.9x 2.3x 2.0x (1%) n/m n/m n/m 101% (22%) n/m n/m n/m Forescout Technologies (US) 832 83% 4.7x 3.8x 3.2x 22% n/m n/m n/m (67%) (12%) n/m n/m n/m Internet of Things (Canada) 11 57% n/a n/a n/a n/a n/a n/a n/a n/a n/a n/a n/a n/a ShotSpotter (US) 174 98% 9.2x 6.6x 4.9x 37% n/m n/m 21.5x 181% 6% n/m n/m 59.9x Mean 5.1x 4.2x 3.7x 14% 15.9x 21.4x 25.2x 8% 18% 21.0x 34.3x 39.5x Online Brokerage Charles Schwab (US) - 94% n/m n/m n/m 14% n/m n/m n/m 22% 50% 34.3x 22.8x 19.2x TD Ameritrade (US) - 95% n/m n/m n/m 20% n/m n/m n/m 26% 40% 35.0x 19.8x 16.1x E*TRADE (US) - 97% n/m n/m n/m 11% n/m n/m n/m 12% 49% 23.8x 18.2x 16.5x Interactive Brokers (US) - 95% n/m n/m n/m 14% n/m n/m n/m 27% 80% 46.8x 32.6x 27.1x Alfa Financial Software (Europe) 1,146 63% 11.4x 10.7x 9.4x 10% 24.6x 22.6x 20.0x 11% 47% 32.8x 30.6x 27.0x Mean 5.2x 4.2x 3.4x 18% 15.9x 21.4x 23.4x 56% (3%) 21.0x 34.3x 49.7x Source: Capital IQ (as of 22 March 2018). 23
 NOAH Bible Page 22 Page 24