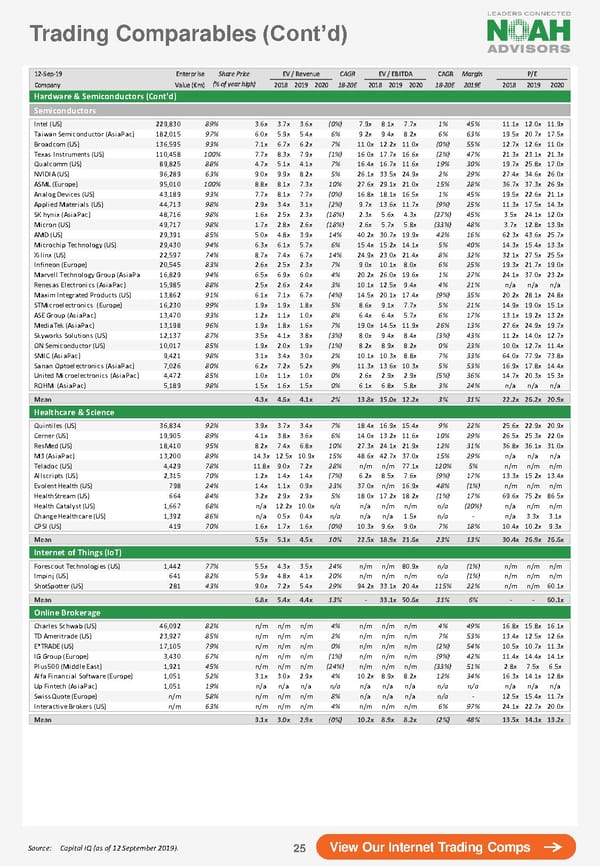
Trading Comparables(Cont’d) 12-Sep-19 Enterprise Share Price EV / Revenue CAGR EV / EBITDA CAGR Margin P/E Company Value (€m) (% of year high) 2018 2019 2020 18-20E 2018 2019 2020 18-20E 2019E 2018 2019 2020 Hardware & Semiconductors (Cont'd) Semiconductors Intel (US) 229,830 89% 3.6x 3.7x 3.6x (0%) 7.9x 8.1x 7.7x 1% 45% 11.1x 12.0x 11.9x Taiwan Semiconductor (AsiaPac) 182,015 97% 6.0x 5.9x 5.4x 6% 9.2x 9.4x 8.2x 6% 63% 19.5x 20.7x 17.5x Broadcom (US) 136,595 93% 7.1x 6.7x 6.2x 7% 11.0x 12.2x 11.0x (0%) 55% 12.7x 12.6x 11.0x Texas Instruments (US) 110,458 100% 7.7x 8.3x 7.9x (1%) 16.0x 17.7x 16.6x (2%) 47% 21.3x 23.1x 21.3x Qualcomm (US) 89,825 88% 4.7x 5.1x 4.1x 7% 16.4x 16.7x 11.6x 19% 30% 19.7x 25.8x 17.0x NVIDIA (US) 96,289 63% 9.0x 9.9x 8.2x 5% 26.1x 33.5x 24.9x 2% 29% 27.4x 34.6x 26.0x ASML (Europe) 95,010 100% 8.8x 8.1x 7.3x 10% 27.6x 29.1x 21.0x 15% 28% 36.7x 37.3x 26.9x Analog Devices (US) 43,189 93% 7.7x 8.1x 7.7x (0%) 16.8x 18.1x 16.5x 1% 45% 19.5x 22.6x 21.1x Applied Materials (US) 44,713 98% 2.9x 3.4x 3.1x (2%) 9.7x 13.6x 11.7x (9%) 25% 11.3x 17.5x 14.3x SK hynix (AsiaPac) 48,716 98% 1.6x 2.5x 2.3x (18%) 2.3x 5.6x 4.3x (27%) 45% 3.5x 24.1x 12.0x Micron (US) 49,717 98% 1.7x 2.8x 2.6x (18%) 2.6x 5.7x 5.8x (33%) 48% 3.7x 12.8x 13.9x AMD (US) 29,391 85% 5.0x 4.8x 3.9x 14% 40.2x 30.7x 19.9x 42% 16% 62.3x 43.6x 25.7x Microchip Technology (US) 29,430 94% 6.3x 6.1x 5.7x 6% 15.4x 15.2x 14.1x 5% 40% 14.3x 15.4x 13.3x Xilinx (US) 22,597 74% 8.7x 7.4x 6.7x 14% 24.9x 23.0x 21.4x 8% 32% 32.1x 27.5x 25.5x Infineon (Europe) 20,545 83% 2.6x 2.5x 2.3x 7% 9.0x 10.1x 8.0x 6% 25% 19.3x 21.7x 19.0x Marvell Technology Group (AsiaPac) 16,829 94% 6.5x 6.9x 6.0x 4% 20.2x 26.0x 19.6x 1% 27% 24.1x 37.0x 23.2x Renesas Electronics (AsiaPac) 15,985 88% 2.5x 2.6x 2.4x 3% 10.1x 12.5x 9.4x 4% 21% n/a n/a n/a Maxim Integrated Products (US) 13,862 91% 6.1x 7.1x 6.7x (4%) 14.5x 20.1x 17.4x (9%) 35% 20.2x 28.1x 24.8x STMicroelectronics (Europe) 16,230 99% 1.9x 1.9x 1.8x 5% 8.6x 9.1x 7.7x 5% 21% 14.9x 19.0x 15.1x ASE Group (AsiaPac) 13,470 93% 1.2x 1.1x 1.0x 8% 6.4x 6.4x 5.7x 6% 17% 13.1x 19.2x 13.2x MediaTek (AsiaPac) 13,198 96% 1.9x 1.8x 1.6x 7% 19.0x 14.5x 11.9x 26% 13% 27.6x 24.9x 19.7x Skyworks Solutions (US) 12,137 87% 3.5x 4.1x 3.8x (3%) 8.0x 9.4x 8.4x (3%) 43% 11.2x 14.0x 12.7x ON Semiconductor (US) 10,017 85% 1.9x 2.0x 1.9x (1%) 8.2x 8.9x 8.2x 0% 23% 10.0x 12.7x 11.4x SMIC (AsiaPac) 9,421 98% 3.1x 3.4x 3.0x 2% 10.1x 10.3x 8.8x 7% 33% 64.0x 77.9x 73.8x Sanan Optoelectronics (AsiaPac) 7,026 80% 6.2x 7.2x 5.2x 9% 11.3x 13.6x 10.3x 5% 53% 16.9x 17.8x 14.4x United Microelectronics (AsiaPac) 4,472 85% 1.0x 1.1x 1.0x 0% 2.6x 2.9x 2.9x (5%) 36% 14.7x 20.3x 15.3x ROHM (AsiaPac) 5,189 98% 1.5x 1.6x 1.5x 0% 6.1x 6.8x 5.8x 3% 24% n/a n/a n/a Mean 4.3x 4.6x 4.1x 2% 13.8x 15.0x 12.2x 3% 31% 22.2x 26.2x 20.9x Healthcare & Science Quintiles (US) 36,834 92% 3.9x 3.7x 3.4x 7% 18.4x 16.9x 15.4x 9% 22% 25.6x 22.9x 20.9x Cerner (US) 19,905 89% 4.1x 3.8x 3.6x 6% 14.0x 13.2x 11.6x 10% 29% 26.5x 25.3x 22.0x ResMed (US) 18,410 95% 8.2x 7.4x 6.8x 10% 27.3x 24.1x 21.9x 12% 31% 36.8x 36.1x 31.0x M3 (AsiaPac) 13,200 89% 14.3x 12.5x 10.9x 15% 48.6x 42.7x 37.0x 15% 29% n/a n/a n/a Teladoc (US) 4,429 78% 11.8x 9.0x 7.2x 28% n/m n/m 77.1x 120% 5% n/m n/m n/m Allscripts (US) 2,315 70% 1.2x 1.4x 1.4x (7%) 6.2x 8.5x 7.6x (9%) 17% 13.3x 15.2x 13.4x Evolent Health (US) 798 24% 1.4x 1.1x 0.9x 23% 37.0x n/m 16.9x 48% (1%) n/m n/m n/m HealthStream (US) 664 84% 3.2x 2.9x 2.9x 5% 18.0x 17.2x 18.2x (1%) 17% 69.6x 75.2x 86.5x Health Catalyst (US) 1,667 68% n/a 12.2x 10.0x n/a n/a n/m n/m n/a (20%) n/a n/m n/m Change Healthcare (US) 1,392 86% n/a 0.5x 0.4x n/a n/a n/a 1.5x n/a - n/a 3.3x 3.1x CPSI (US) 419 70% 1.6x 1.7x 1.6x (0%) 10.3x 9.6x 9.0x 7% 18% 10.4x 10.2x 9.3x Mean 5.5x 5.1x 4.5x 10% 22.5x 18.9x 21.6x 23% 13% 30.4x 26.9x 26.6x Internet of Things (IoT) Forescout Technologies (US) 1,442 77% 5.5x 4.3x 3.5x 24% n/m n/m 80.9x n/a (1%) n/m n/m n/m Impinj (US) 641 82% 5.9x 4.8x 4.1x 20% n/m n/m n/m n/a (1%) n/m n/m n/m ShotSpotter (US) 281 43% 9.0x 7.2x 5.4x 29% 94.2x 33.1x 20.4x 115% 22% n/m n/m 60.1x Mean 6.8x 5.4x 4.4x 13% - 33.1x 50.6x 31% 6% - - 60.1x Online Brokerage Charles Schwab (US) 46,092 82% n/m n/m n/m 4% n/m n/m n/m 4% 49% 16.8x 15.8x 16.1x TD Ameritrade (US) 23,927 85% n/m n/m n/m 2% n/m n/m n/m 7% 53% 13.4x 12.5x 12.6x E*TRADE (US) 17,105 79% n/m n/m n/m 0% n/m n/m n/m (2%) 54% 10.5x 10.7x 11.3x IG Group (Europe) 3,430 67% n/m n/m n/m (1%) n/m n/m n/m (9%) 42% 11.4x 14.4x 14.1x Plus500 (Middle East) 1,921 45% n/m n/m n/m (24%) n/m n/m n/m (33%) 51% 2.8x 7.5x 6.5x Alfa Financial Software (Europe) 1,051 52% 3.1x 3.0x 2.9x 4% 10.2x 8.9x 8.2x 12% 34% 16.3x 14.1x 12.8x Up Fintech (AsiaPac) 1,051 19% n/a n/a n/a n/a n/a n/a n/a n/a n/a n/a n/a n/a SwissQuote (Europe) n/m 58% n/m n/m n/m 8% n/a n/a n/a n/a - 12.5x 15.4x 11.7x Interactive Brokers (US) n/m 63% n/m n/m n/m 4% n/m n/m n/m 6% 97% 24.1x 22.7x 20.0x Mean 3.1x 3.0x 2.9x (0%) 10.2x 8.9x 8.2x (2%) 48% 13.5x 14.1x 13.2x Source: Capital IQ (as of 12 September 2019). 25 View Our Internet Trading Comps
 The NOAH Bible Page 24 Page 26