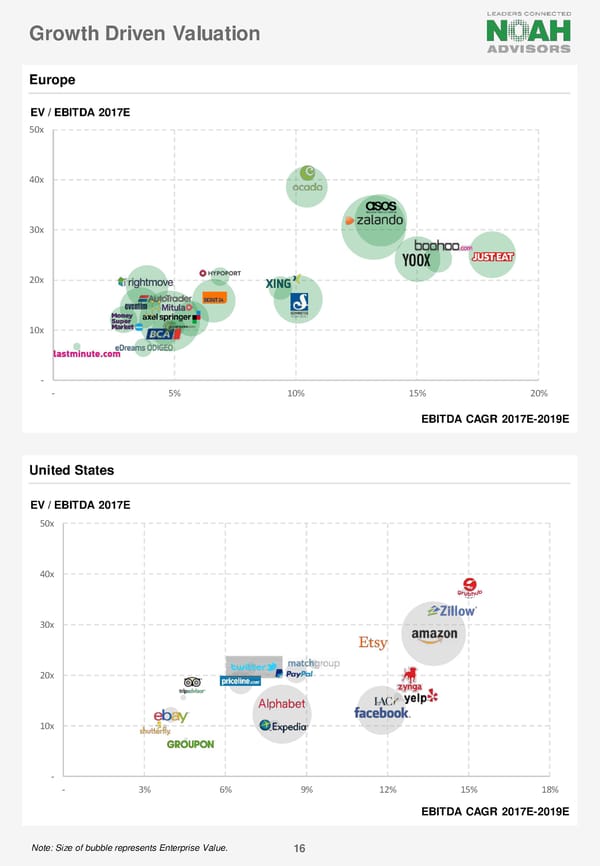
Growth Driven Valuation Europe EV / EBITDA 2017E 50x 40x 30x 20x 10x - - 5% 10% 15% 20% EBITDA CAGR 2017E-2019E United States EV / EBITDA 2017E 50x 40x 30x 20x 10x - - 3% 6% 9% 12% 15% 18% EBITDA CAGR 2017E-2019E Note: Size of bubble represents Enterprise Value. 16
 NOAH Bible Page 15 Page 17