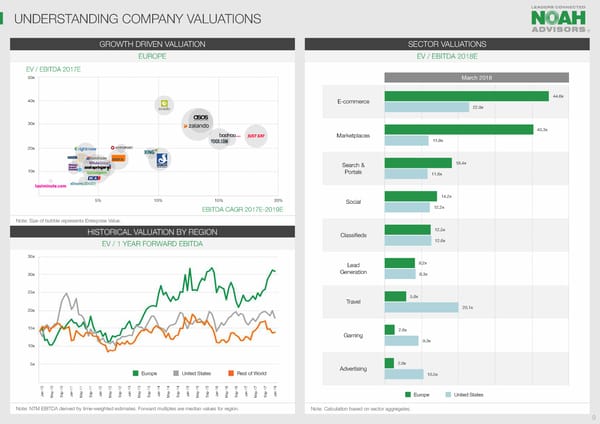
UNDERSTANDING COMPANY VALUATIONS ® GROWTH DRIVEN VALUATION SECTOR VALUATIONS EUROPE EV / EBITDA 2018E EV / EBITDA 2017E 50x March 2018 44.6x 40x E-commerce 22.9x 30x 40.3x Marketplaces 11.8x 20x Search & 18.4x 10x Portals 11.6x 14.2x 5% 10% 15% 20% Social EBITDA CAGR 2017E-2019E 12.2x Note: Size of bubble represents Enterprise Value. HISTORICAL VALUATION BY REGION 12.5x Classifieds EV / 1 YEAR FORWARD EBITDA 12.6x 35x Lead 8.2x 30x Generation 8.3x 25x 5.8x Travel 20x 20.1x 15x 2.6x Gaming 9.3x 10x 5x 2.6x Advertising Europe United States Rest of World 10.5x Jan-10May-10Sep-10Jan-11May-11Sep-11Jan-12May-12Sep-12Jan-13May-13Sep-13Jan-14May-14Sep-14Jan-15May-15Sep-15Jan-16May-16Sep-16Jan-17May-17Sep-17Jan-18EuropeUnited States Note: NTM EBITDA derived by time-weighted estimates. Forward multiples are median values for region. Note: Calculation based on sector aggregates. 9
 NOAH Advisors Overview Page 8 Page 10